


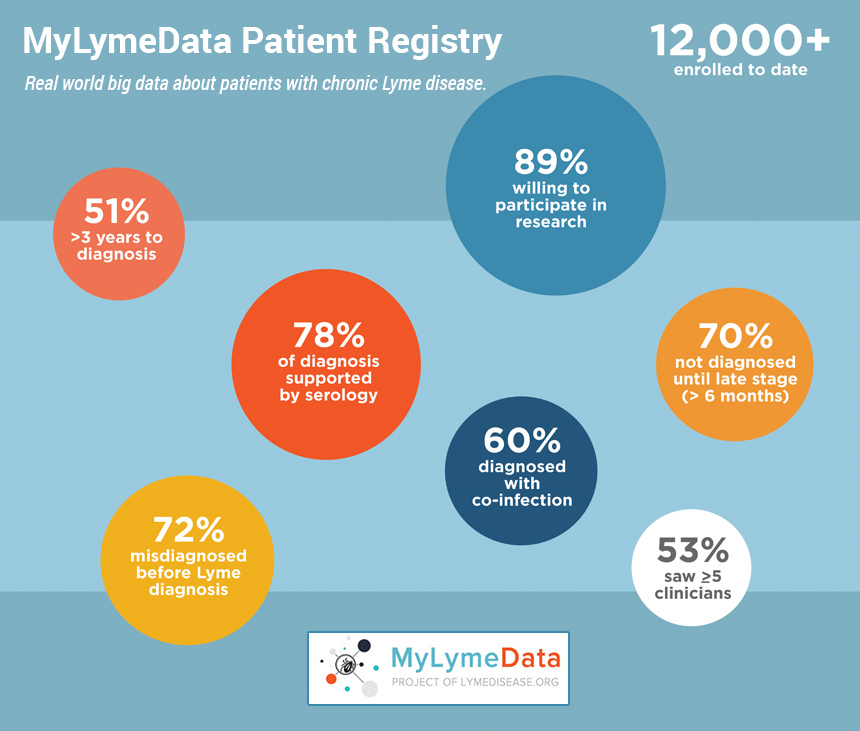
We are pleased to present the 2019 Chart Book for the MyLymeData patient registry. MyLymeData has enrolled over 12,000 participants and is currently among the top 5% of patient registries in the nation.
Click on image to view larger image
Download Your 36 page full color
2019 MyLymeData Chart Book
Capturing information about patients with chronic Lyme disease that was previously unknown.
The focus of the report is on the 3,903 patients who were enrolled during the first year of the registry. The report captures a lot of information about patients with chronic Lyme disease that was previously unknown. This is largely because real world data about patients with chronic Lyme disease has not been collected or analyzed. We have prepared a brief video of the Highlights which you can watch by clicking the link below.
MyLymeData Highlights Presentation by Lorraine Johnson, JD, MBA
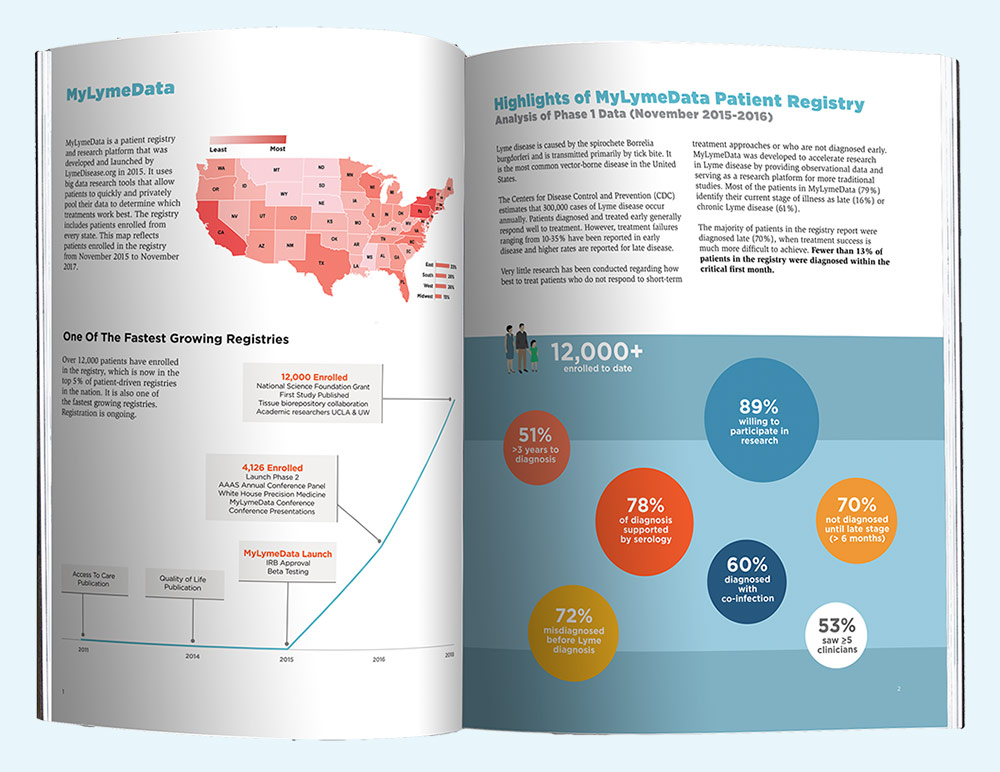
As many of you know, in 2015, we launched MyLymeData, our patient registry, and research platform and we now have over 12,000 patients enrolled, it's one of the largest observational studies of Lyme disease ever conducted—and actually one of the largest patient-driven registries in the nation. So it's a rather remarkable achievement that we have patients enrolled from every state in the nation and have collected over 2-5 million data points. We have been pulling together some of the descriptive statistics for this report. Actually, I found that there were some things that just stood out to me and surprised me. I want to share those with you.
First of all, 70% of the people in the registry were not diagnosed until they had late Lyme disease. That surprised me, because I thought, perhaps the reason people develop chronic Lyme disease was due to early treatment failures. But it turns out that most people in the registry are people who were diagnosed late. That means that we have a really big problem with late diagnosis but we also have this extraordinary opportunity to improve that statistic by reducing the number of people who are diagnosed late and by diagnosing and treating them earlier when treatments are more effective.
Second 60% report that they have co-infections and that means that the risk of having a co-infection may actually be a risk factor for developing chronic Lyme disease. Third most of the patients in the registry have positive serology. For almost all of these patients that includes some form of Western Blot. Now to be eligible to participate in the registry, you have to have been diagnosed by a clinician or report that you've been diagnosed by clinicians so that together with a high rate of people who are testing positive on the Lyme tests provides validation that those who are in the registry, in fact, do have Lyme disease. For most patients in the registry it is taking far too long for diagnosis. Fifty-one percent say that it's taken them three years to obtain a diagnosis with 53% seeing five or more clinicians. The number of people who are diagnosed within that first critical months when treatments are more effective is only 12%. That means the main problem for people with chronic Lyme disease is late diagnosis. We should be able to fix that.
Before we get too deep into the weeds here, I want to point out that LymeDisease.org has been conducting patient registries and using patient generated to data over 10 years. We published our first study on access to care on access to care in 2011. In 2014, we published our quality of life study. Just this last year we published our first study using registry data. I'm going to describe some of the findings from these studies and suggest that there are certain factors that may be associated with delayed diagnosis.
Now many times we hear that patients with chronic Lyme disease are suffering from no more than the aches and pains of daily living. This chart is from one of our previous studies with co-authors Dr. Stricker and Mankoff. Basically, what we found was, and a number of other studies have found this too, was that the quality of life for patients, who have chronic Lyme disease is very poor. Much worse for example, than patients with MS, diabetes, or congested part failure. The question we, asked by the way, is called self-reported health status and it is used by the CDC and other government agencies in their survey work. So it's a standard question. It's used in clinical trials of Lyme disease as part of the SF-36.
We also looked at some other government standardized questions in that same study. Specifically, we asked in a 30 day period for patients to tell use the number of bad physical days they experienced, the number of activity limited days, and the number of bad mental days. On the chart the orange balls are represent the Lyme patients, the blue balls represent the general population. Because this is again a standard government question we were able to make that comparison between the general population and Lyme patients. Government agencies ask this question on their general health surveys that they conduct annually. And they ask it of many different diseases. But if you look, for example, at a bad physical days, you can see that for Lyme patients the reporting in a month twenty bad physical days compared to say, three days for the normal population--so that's really quite a big difference in terms of how this population is doing. Patients with chronic Lyme disease are far sicker than the general population.
Now let me tell you a little bit about phase one of MyLymeData. This table up on the left, it describes the sample in the study. For Phase 1 of MyLymeData, 4,700 patients enrolled. But for this analysis we excluded those that were not from the US or patients who hadn't been clinically diagnosed by a healthcare provider. That reduced the final sample size to 3,093. Of those patients, 3,556 identified themselves as being ill and 347 identified themselves as being well. We also asked a lot diagnostic validation questions. You can see those down to the left. So were you diagnosed by a clinician? Do you recall a rash? What were your signs or symptoms. What was your exposure? Do you recall being bit by a tick? What were your lab test results for Lyme disease. Do you have other tick-borne co-infections? We ask about functional impairment as well.
And over on the right side you'll see the percentage of people who were diagnosed by a clinician—100%--that’s because diagnosis by a clinician is an entry criteria to be included in the registry. The percentage that recall the tick bite was 41%, the percentage that we called an EM rash was 34%, the percentage was supporting lab tests was 78%. And 60% reported having one or more co-infection. Most of the patients reported their current disease status as chronic Lyme (61%), about 18% said that they had late untreated Lyme, and early Lyme disease was 6%.
Most of the people in the registry were females-- about 83%. And we're will talk a little bit later about why this population with chronic Lyme disease might be more inclined to be female. And then the final point to make about the people in the registry is this is a highly educated population. Almost everybody has some college.
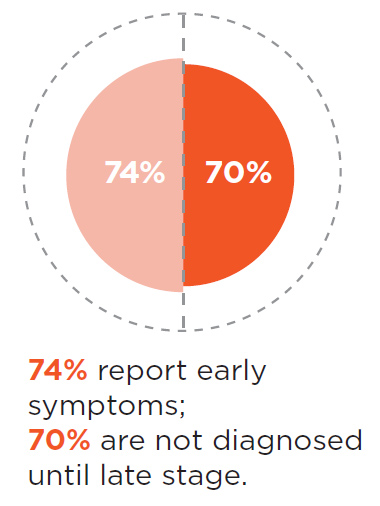
One question we ask patients was whether they recalled having early symptoms and 74% reported that they did have early symptoms yet, 70% were not diagnosed until late stage. That's the diagnostic gap we need to close. This is what the CDC would call a winnable battle. But you have to try, you have to identify why patients are not being diagnosed early, and you need to fill those gaps and as we go along I'm going to point out some places where diagnostic ears may occur.
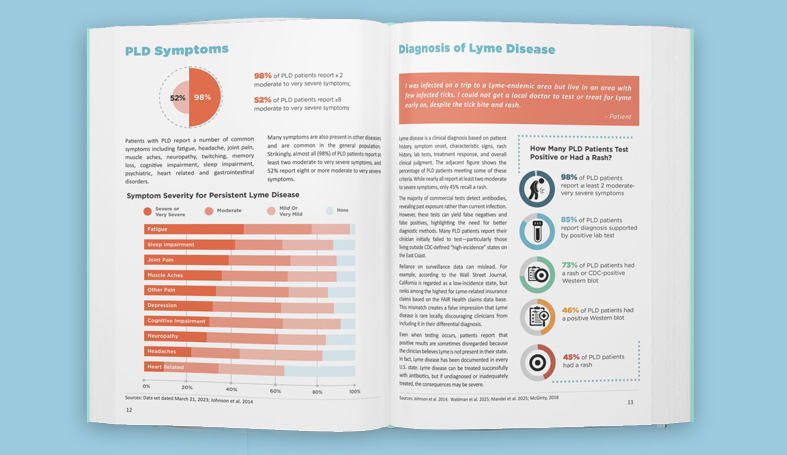
As this slide shows, one issue may be that many of the early symptoms that patients report in the registry are not necessarily what physicians are looking for. For example, only 34% of patients reported having the rash and when you compare that with 64%Who had flu-like symptoms, or 44% who had headaches and next stiffness, you can see there's really a predominance of these other symptoms are much more common—but likely overlooked. John Alcott out of Johns Hopkins has pointed out in one of his papers, the 50-4% of patients who do not have a distinct and rash are not diagnosed correctly. As I’ve said late diagnosis may be a predictive factor for developing chronic Lyme disease and not having a rash in particular, may be one of the factors that makes it more likely to develop chronic Lyme disease.
Most of the patients in the registry report that they've had positive lab to supporting their diagnosis that 78% and note that 45%, roughly are CDC positive on either by two-tiered or by a stand-alone western blot. Another 45% have a positive western blot that's been interpreted by a standard other than the CDC standard. My guess is that most of these patients are being determined to have a positive test based on studies by Ma and Engstrom some time ago that uses fewer bands in their criteria. Many patients in the registry report having co-infections--60% in fact. These co-infection percentages in the chart overlap because some patients have multiple co-infections. Those in dark blue reflect patients that had positive serology supporting their co-infection diagnosis, the light blue or patients who did not have positive results. My presumption is that these patient were clinically diagnosed based on signs and symptoms. The bottom line is that number of co-infections is really quite high in this population--far higher than is reported in the acute Lyme population. The presence of co-infections may be a predictive factor for who goes on to develop chronic Lyme disease.
Most patients with chronic Lyme Disease in the registry report that they were initially misdiagnosed with another condition and note that a majority of those misdiagnosed report that they were misdiagnosed with a psychiatric illness but only 18 present report, the psychiatric symptoms were among their worst symptoms. So that's quite a disparity.
Other conditions misdiagnosed initially include many diseases that have no hope of a cure such as fibromyalgia, chronic fatigue, MS, and so forth. Patients diagnosed with these types of illnesses they may be put on palliative care, which is treating the symptoms rather than trying to address the underlying cause, and that may make a big difference. These patients who are misdiagnosed will likely be delayed in terms of getting an accurate diagnosis, and they may be put on medications that have side effects that adversely affect them.
This next slide shows the types of symptoms that chronic Lyme patients report having in large numbers. So pain is reported by 71%; fatigue 62%; sleep impairment 20%; psychiatric 18%. Below this chart you can see that there's a list of different medications that are given. Again, here we have asked a standard government question which allows us to use other government data collected from the general population to make comparisons. So for example, and sleep medications, you can see that the general population maybe 7 or 8% are taking sleep medications put in Lyme disease is closer to 34%, this sort of disparity also exists with thyroid, antidepressants, and prescription pain medications.
Another thing that we looked at was the symptoms reported by patients as their three worst. Often we hear that fatigue is a number one symptom for Lyme disease but it really depends on how you break these things down. When neurologic symptoms for example are combined, what you see is that 84% of patients report having some type of neurologic symptoms--that's far higher than fatigue, which is 62% and musculoskeletal is just 57%. This chart below indicates how we actually did the breakdown for the symptoms that were deemed to be neurologic. Dr. Stricker helped me with this breakdown which includes cognitive symptoms, neuropathy, sleep impairment, headache, memory loss and twitching.
We frequently hear that people with Lyme disease are all taking antibiotics and that's simply not true only 52% of those who are ill or taking antibiotics and only 5% of those are taking IV antibiotics. So really, the numbers are far smaller than what some people believe.
Of course, patients who aren't taking antibiotics I have a lot of reasons for not taking them. It's one thing to choose not to take antibiotics for personal reasons, but it's quite another to not be able to obtain them because you have no access to treating physicians (as 26% report) or because your insurance company won't pay for them (18%)or because the cost is simply too much for you (14%). This means that access to antibiotic treatment is a big issue as, by the way, is the lack of insurance coverage. 50% of patients report their providers do not accept insurance. These factors have a big impact on patient's ability to obtain the care that they need.
The last thing I want to point out on this slide is that 95% of patients report that they're diagnosed primary care clinicians, only 5% or diagnosed by infectious disease specialist. But when you take a look at what's going on in the Lyme environment, the guidelines of infectious disease specialists hold a tremendous amount of weight in the ability of patients to get diagnosed and treated. The 5% of physicians who diagnose these patients are setting the rules for the other 95% is what that boils down to.
As I mentioned earlier, we published our first study using data from the registry. Mira Shapiro (a biostatistician) and Dr. Mankoff were both co-authors on this study. What we were looking at was whether patients varied in the response to antibiotic treatment for whether they all tended to respond the same. Most of the studies of Lyme Disease report on average treatment response. That is, they looks at how people do on average rather than how they respond individually. In fact, most of the studies on Lyme disease have been too small to look at subgroups. The NIH funded studies, for example, had samples ranging between 37 and 129. You can't do sub-group analysis when you're dealing with a samples that small. But our sample was well over 3000. Because of this, we were able to actually take a look and see how patients varied in their treatment response.
As the chart shows, 52% reported that they were better since they've been taking antibiotics. The question we asked patients was very simple and has been validated in a number of studies for other diseases. We asked: since you've been treating your Lyme disease with antibiotics would you say your symptoms are better, worse, or unchanged. If someone said they were better, we asked "Well how much better, just a little bit better or a very great deal better.” And so that was an eight-point scale for that question. And the same thing with worse, we asked the same thing. As you see see most patients reported, they were better 52%. People who are worse was just 12%. About a third were unchanged. The proportion of people who said that they were moderately to a very great deal better was about 35%. That's really quite a high treatment response there—we called these people “high responders”. Below that chart at the very bottom is a figure of a little scale that ranges from -7 to +7, with zero as the midpoint. Zero would point to no treatment effect at all. The average treatment effect that we found for the whole sample was 1.7, so on a scale that goes from negative seven to positive 7—well 1.7 is just a very little bit better. Nothing to write home about, right?
But the average treatment effect for the high responders was 5.3—5.3 out of 7--, that's actually quite a large treatment response. Those who were unchanged or worse had quite a small amount of change—they were negative 1.1—so really not much worse. So you can see that breaking this down into sub-groups and identifying the high responders, and what it is about them that might make them high responders, would be something to be really important for informing how you might want to treat patients.
Many patients are using alternative treatments. Roughly, 70% are using alternative treatments either alone or in conjunction with antibiotics and patients who elect to take alternative treatments either do this by choice as I pointed out earlier –which is their prerogative. But, it is important to keep in mind, that often not using antibiotics is an access to care issue. 31% report using alternative treatments exclusively to treat their disease. The most effective alternative treatments noted were herbal protocols which may have an antimicrobial effect. The least effected was stem cell, which was effective for only 3% of the people who had it. On stem cell treatments, we had a sample size of about 300, which is kind of amazing considering how unusual it is as a treatment approach. And by the way this chart is an interactive chart. It was a created for us by Steve Wexler to whom we were very grateful. It's available on our website. You can go to any one of those items that's listed there and click on it and it'll pop up and give you full information on how many people tried it, how many people found it effective at different levels, and how many people were reporting side effects on the protocol.
I want to conclude by asking the question I started with, "Why do patients develop chronic Lyme disease? Some of the factors that I mentioned during this presentation, include the presence of co-infections. A lot of patients in MyLymeData report infections and you have to ask are these making their condition worse, harder-to-treat or more intractable?
At the beginning of this presentation, I also noted that 70% of the patients in MyLymeData report that they were not diagnosed until they had late Lyme disease--that is six months or later following symptom onset. Is delayed diagnosis a factor? We think so, but how big a factor is it? We need to find out, and we need to reduce the time to diagnosis for patients with Lyme disease.
Another factor I think is important, perhaps is diagnostic delays caused when patients do not test positive using CDC, testing criteria because a lot of the tests that are out there are based on CDC criteria and a lot of those tests return false negative test results, in fact, roughly 50% of files are false negatives. More specifically, I'm talking about the use of overly restrictive banding criteria on the CDC Western Blot and the insensitivity of the Elisa
Not being from the northeast where Lyme disease is on the radar for clinicians may also cause diagnostic delays because Lyme disease may not be included in the differential diagnosis of the physician at the first office visit. Other factors include not having a rash, which maybe another reason, patients aren't being diagnosed early.
And finally, I'm going to mention being female. We don't know the effect that being female has but Dr. Mankoff has offered to lean in on this and help us try to figure it out. We think it may actually have quite a role in it.
Most patients in the registry or female. Do gender differences affect diagnostic test results, the presence of a rash immune response or treatment response? Are Lyme disease symptoms of females more readily dismissed by physicians resulting in diagnostic delays. These are all important questions that we need to address.
Let me close today by saying that if you have Lyme disease, or know of someone with Lyme disease that is not enrolled in MyLymeData, please, enroll today by visiting MyLymeData.org. If you would like to download a copy of the 36 page. MyLymeData highlights report, go to Lyme disease. And of course, this work can only be done with the support of patients like you if you are not a member of LymeDisease.org please consider making a donation and becoming a member of this vibrant community today.
Thank you for your time.
Some of the information in the report may help explain why some patients are more likely to develop chronic Lyme disease in the first place. For example, did you know that:
- 70% of those in the registry were not diagnosed until six months or more following the onset of their symptoms. Most patients take three or more years to diagnosis and see five or more clinicians. Studies show that patients diagnosed late are less responsive to short-term antibiotic treatment.
- Fewer than 12% of patients in the registry were diagnosed within the critical first month. Most patients who are diagnosed and treated early respond well to short term treatment protocols.
- 74% reported early symptoms of the disease, but only 34% recall having the distinctive erythema migrans rash (EM) commonly relied on by physicians for diagnosis. More common early symptoms were flu-like symptoms (64%) and severe head-ache or stiff neck (44%). Patients who do not have an EM rash are more likely to be misdiagnosed.
- 60% report that they have been diagnosed with an additional tick-borne infection, such as Babesia or Ehrlichia. The presence of co-infections may increase the likelihood of developing chronic Lyme disease.
- 72% of patients with chronic Lyme disease report that they were initially misdiagnosed with another condition. Patients misdiagnosed with another condition experience diagnostic delays and may be exposed to adverse effects from treatments for diseases that they do not have.
Patients aren’t diagnosed and treated soon enough
Although early antibiotic treatment failures occur too often (ranging from 10-35% depending on the study), the larger problem is that too many patients aren’t diagnosed and treated soon enough. Seventy percent of patients with late or chronic Lyme disease in the registry are not diagnosed until six months or more after symptom onset. Yet, no one has researched the best way to treat this population. Protocols developed for acute disease do not appear to be effective. We need better treatments for late-stage, untreated Lyme disease.
Only 12% of patients in the registry were diagnosed within the critical first month. Patients who are not diagnosed early often develop serious, chronic symptoms such as cognitive impairment, severe joint pain, headache, and fatigue.
It’s critical to identify why Lyme disease patients are not being diagnosed early, to shorten the time to diagnosis and to develop better treatments for patients diagnosed late.
Download The 2019 MyLymeData Chart Book
We invite you to download and review the chart book.
We are deeply grateful to everyone who has supported this work—particularly the patients with Lyme disease who make this work possible by generously sharing their information.
- Johnson, Lorraine (2019): 2019 Chart Book — MyLymeData Registry. (Phase 1 April 27, 2017. Sample 3,903). figshare. Preprint. https://doi.org/10.6084/m9.figshare.7849244
- Adrion ER, Aucott J, Lemke KW, Weiner JP. Health care costs, utilization and patterns of care following Lyme disease. PLoS ONE. 2015;10(2):e0116767. Available from: http://www.ncbi.nlm.nih.gov/pubmed/25650808.
- Aucott J, Morrison C, Munoz B, Rowe PC, Schwarzwalder A, West SK. Diagnostic challenges of early Lyme disease: lessons from a community case series. BMC Infect Dis. 2009;9:79. Available from: http://www.ncbi.nlm.nih.gov/pubmed/19486523.
- Blackwell DL, Lucas JW, TC. C. Summary health statistics for U.S. adults: National Health Interview Survey, 2012. . Vital Health Stat 10(260) 2014. 2014. Available from: https://www.cdc.gov/nchs/data/series/sr_10/sr10_260.pdf
- Centers for Disease Control and Prevention. Lyme Disease -- United States, 1992-2006. MMWR, 2008; 57((10)). Available from: https://www.cdc.gov/mmwr/pdf/ss/ss5710.pdf .
- Clinical and Translational Science Awards Consortium. Community Engagement Key Function Committee. Task Force on the Principles of Community Engagement., United States. Department of Health and Human Services., National Institutes of Health (U.S.), Centers for Disease Control and Prevention (U.S.), United States. Agency for Toxic Substances and Disease Registry. Principles of community engagement. Second edition.
- Department of Health and Human Services, Maine Center for Disease Control and Prevention, Report to Maine Legislature: Lyme Disease. 2010.
- Davis K, Collins S, Doty M, Ho A, Holmgren A. Health and Productivity Among U.S. Workers. The Commonwealth Fund Issue Brief 856. 2005. Available from: https://www.commonwealthfund.org/sites/default/files/documents/___media_files_publications_issue_brief_2005_aug_health_and_productivity_among_u_s__workers_856_davis_hlt_productivity_usworkers_pdf.pdf
- Fallon, B.A.; Keilp, J.G.; Corbera, K.M.; Petkova, E.; Britton, C.B.; Dwyer, E.; Slavov, I.; Cheng, J.; Dobkin, J.; Nelson, D.R.; et al. A randomized, placebocontrolled trial of repeated iv antibiotic therapy for Lyme encephalopathy. Neurology 2008, 70, 992–1003.
- Fallon BA, Kochevar JM, Gaito A, Nields JA. The underdiagnosis of neuropsychiatric Lyme disease in children and adults. Psychiatr Clin North Am. 1998 Sep;21(3):693-703, viii. Available from: http://www.ncbi.nlm.nih.gov/entrez/query.fcgi?cmd=Retrieve&db=PubMed&dopt=Citation&list_uids=9774805
- Gliklich, R.D.N.; Leavy, M. (Eds.) Registries for Evaluating Patient Outcomes: A User’s Guide, 3rd ed.; Agency for Healthcare Research and Quality: Rockville, MD, USA, 2014. https://effectivehealthcare.ahrq.gov/topics/registries-guide-3rd-edition/research
- Groft, S. Patient Registries As a Prelude to Clinical Trials and Post-Approval Studies; Pediatric Devices for Rare Diseases Food and Drug Administration: White Oak, MD, USA, 8 January 2014.
- Henry J. Kaiser Family Foundation, Percent of Adults Reporting Fair or Poor Health Status https://www.kff.org/other/state-indicator/percent-of-adults-reporting-fair-or-poor-health-status/?currentTimeframe=0&sortModel=%7B%22colId%22:%22Location%22,%22sort%22:%22asc%22%7D .
- Johnson, Lorraine (2019): Stigma and Privacy in Lyme Disease [Preprint]. https://doi.org/10.6084/m9.figshare.7704167
- Johnson L, Shapiro M, Mankoff J. Removing the Mask of Average Treatment Effects in Chronic Lyme Disease Research Using Big Data and Subgroup Analysis. Healthcare. 2018;6(4):124. Available from: http://www.mdpi.com/2227-9032/6/4/124 .
- Johnson L, Aylward A, Stricker RB. Healthcare access and burden of care for patients with Lyme disease: a large United States survey. Health Policy. 2011 Sep;102(1):64-71. Available from: http://www.ncbi.nlm.nih.gov/pubmed/21676482 .
- Johnson L, Wilcox S, Mankoff J, Stricker RB. Severity of chronic Lyme disease compared to other chronic conditions: a quality of life survey. PeerJ. 2014; 2. Available from: http://dx.doi.org/10.7717/peerj.322 .
- Klempner, M.; Hu, L.; Evans, J.; Schmid, C.; Johnson, G.; Trevino, R.; Norton, D.; Levy, L.; Wall, D.; McCall, J.; et al. Two controlled trials of antibiotic treatment in patients with persistent symptoms and a history of Lyme disease. N. Engl. J. Med. 2001, 345, 85-92. https://www.nejm.org/doi/10.1056/NEJM200107123450202?url_ver=Z39.88-2003&rfr_id=ori:rid:crossref.org&rfr_dat=cr_pub%3dwww.ncbi.nlm.nih.gov
- Kravitz RL, Duan N, Braslow J. Evidence-based medicine, heterogeneity of treatment effects, and the trouble with averages. Milbank Q. 2004;82(4):661-87. https://www.ncbi.nlm.nih.gov/pmc/articles/PMC2690188/
- Krupp, L.B.; Hyman, L.G.; Grimson, R.; Coyle, P.K.; Melville, P.; Ahnn, S.; Dattwyler, R.; Chandler, B. Study and treatment of post Lyme disease (Stop-LD): A randomized double masked clinical trial. Neurology 2003, 60, 1923–1930.
- National Center for Health Statistics. Health, United States, 2016 with Chartbook on Long-term Trends in Health. Hyattsville, MD. 2017. Available from: https://www.cdc.gov/nchs/data/hus/hus16.pdf .
- Stricker RB, Fessler M. Chronic Lyme Disease: A Working Case Definition. American Journal of Infectious Diseases. 2018;14(1):1-44. Available from: http://thescipub.com/pdf/10.3844/ajidsp.2018.1.44
- Wormser GP, Dattwyler RJ, Shapiro ED, Halperin JJ, Steere AC, Klempner MS, et al. The clinical assessment, treatment, and prevention of Lyme disease, human granulocytic anaplasmosis, and babesiosis: clinical practice guidelines by the Infectious Diseases Society of America. Clin Infect Dis. 2006 Nov 1;43(9):1089-134.
- Zhang, X., et al., Economic impact of Lyme disease. Emerg Infect Dis, 2006. 12(4): p. 653-60. https://www.ncbi.nlm.nih.gov/pmc/articles/PMC3294685/
If you are a patient who is not enrolled in MyLymeData, please enroll today. If you are a researcher who wants to collaborate with us, please contact me directly.
The MyLymeData Viz Blog is written by Lorraine Johnson, JD, MBA, who is the Chief Executive Officer of LymeDisease.org. You can contact her at lbjohnson@lymedisease.org. On Twitter, follow her @lymepolicywonk.